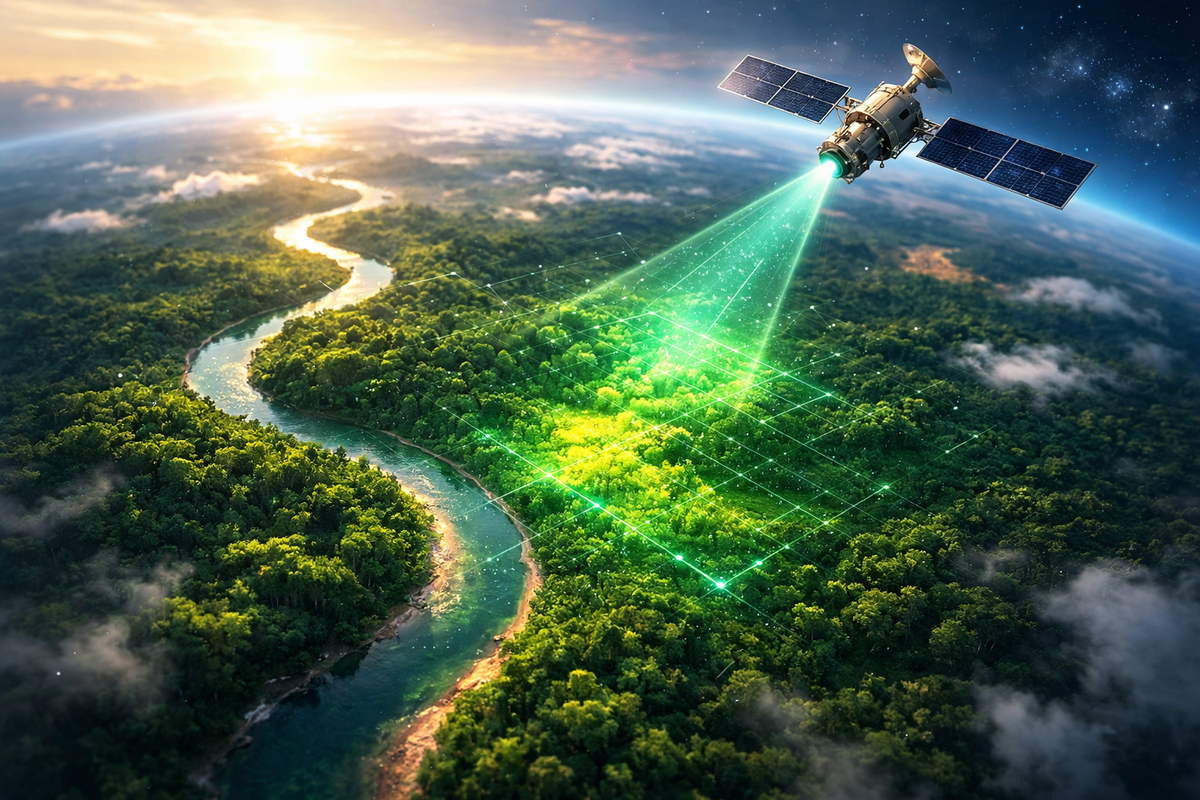
มองโลกจากอวกาศ: ดาวเทียมช่วยวัดการกักเก็บคาร์บอนได้อย่างไร?
ดัชนีพืชพรรณ (Vegetation Index) คืออะไร?
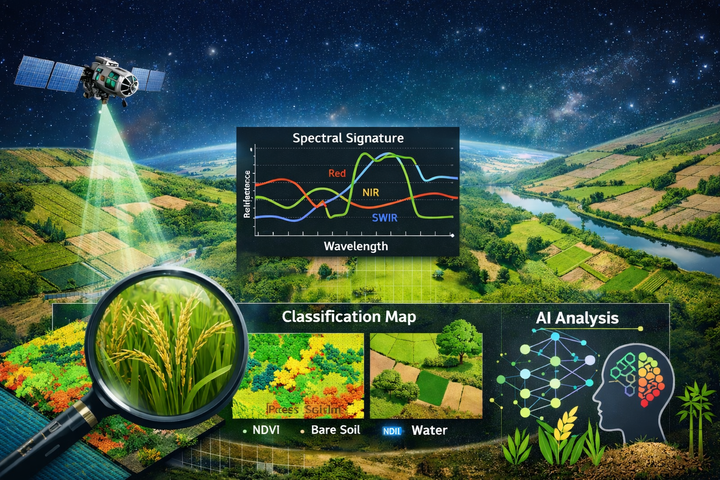
คือค่าที่คำนวณจาก ภาพถ่ายดาวเทียม (Satellite Image) เพื่อวัดความเขียว ความหนาแน่น และสุขภาพของพืช
ตัวอย่างที่ใช้บ่อยที่สุด
NDVI (Normalized Difference Vegetation Index)
สูตร
NDVI = (NIR - Red) / (NIR + Red)
- NIR = Near Infrared (พืชสะท้อนแสงสูง)
- Red = แสงสีแดง (พืชดูดกลืนเพื่อสังเคราะห์แสง)
ค่าอยู่ระหว่าง -1 ถึง 1
|
ค่า NDVI |
ความหมาย |
|
< 0 |
น้ำ เมฆ |
|
0 – 0.2 |
พื้นดิน |
|
0.2 – 0.5 |
พืชเบาบาง |
|
> 0.5 |
พืชหนาแน่น |
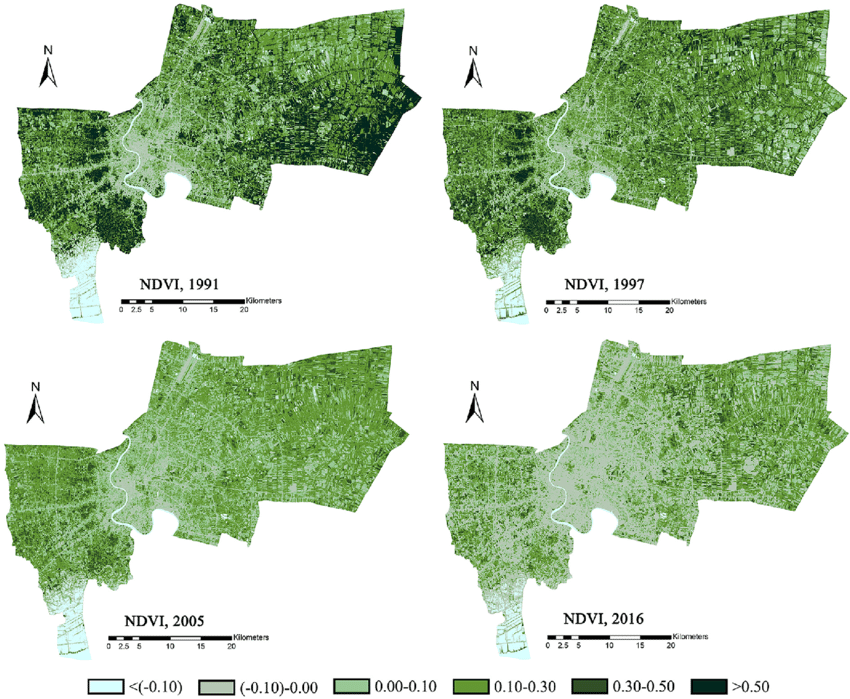
ตัวอย่างภาพ NDVI จากดาวเทียม
ดัชนีพืชพรรณเกี่ยวข้องกับการกักเก็บคาร์บอนอย่างไร?
หลักการสำคัญ
พืชดูด CO₂ ผ่านกระบวนการ Photosynthesis ถ้าหากว่า
- พืชหนาแน่น
- สุขภาพดี
- ชีวมวลสูง (Biomass สูง)
จะมี การกักเก็บคาร์บอน (Carbon Sequestration) สูง
ความสัมพันธ์หลัก
NDVI → Biomass → Carbon Stock
นักวิจัยมักใช้
- NDVI
- EVI (Enhanced Vegetation Index)
- LAI (Leaf Area Index)
- Machine Learning Model
เพื่อประมาณค่า
- Above-ground biomass (AGB)
- Carbon stock (ตันคาร์บอน/เฮกตาร์)
Computer Vision ใช้อย่างไร?
1) ใช้ Deep Learning แทน NDVI
เช่น
- CNN
- U-Net (segmentation)
- Vision Transformer
เพื่อ
- แยกประเภทพืช
- ประเมินความหนาแน่น
- ประมาณ Biomass จากภาพโดยตรง
2) ใช้ Time Series Satellite Data
เช่นจาก
- NASA
- European Space Agency
ดาวเทียมที่นิยม
- Landsat 8
- Sentinel-2
ใช้วิเคราะห์
- การเปลี่ยนแปลงป่าไม้
- Deforestation
- Carbon loss / gain
ตัวอย่างงานจริง Pipeline แบบ Data Science / AI
Step 1: ดึงข้อมูล
- Google Earth Engine
- Sentinel Hub API
Step 2: คำนวณ NDVI
Step 3: สร้าง Feature
- NDVI mean
- NDVI std
- Seasonal variation
- Texture features (GLCM)
Step 4: Train Model
- Random Forest - ทำนาย Biomass
- XGBoost - ทำนาย Carbon stock
- CNN - End-to-end mapping
สามารถพัฒนาต่อยอดได้เป็น
- Carbon credit verification system
- Deforestation detection AI
- Climate change monitoring dashboard
- ESG Analytics platform